Manage Data Warehouse Relationships With The Graph Database
| @intelia | November 30

(Photo By Bob Brewer on Unsplash)
Nowadays, the concepts of data lineage and data literacy are getting more and more popular, however, there are still a number of age-old questions that are left unanswered. Let’s say you have a data warehouse with thousands of data objects, including tables, views, and stored procedures. How can you understand the relationship among those data objects, including stored procedures? And how can you know their relationship with external processes, API, services, dashboards, etc.?
To most data warehouse administrators, this is a valid question. As time goes by, the data warehouse always becomes more and more complicated. Not only does the number of data objects and relationships keep growing, but the number of deprecated and duplicated/ similar data objects also grows as well.
Here, I’d like to share a solution for managing the data warehouse relationship with the graph database.
Before we get started, let’s clarify a couple of concepts to understand why data lineage won’t help.
Data Lineage Is Not The Answer
Data lineage is a map of the data journey, which includes its origin, each stop along the way, and an explanation on how and why the data has moved over time. The data lineage can be documented visually from source to eventual destination — noting stops, deviations, or changes along the way. The process simplifies tracking for operational aspects like day-to-day use and error resolution.
It is made evident that data lineage management is more interested in tracking the dynamic data relationship of how data has been transformed from one stage to the next. If we call the data journey a vertical relationship, we are also interested in knowing the horizontal data relationships, e.g. the big picture of the static relationship. We want to understand how different data objects interact with each other and their similarities or differences.
Graph Database
Compared to the traditional relational database, key-value store, or document database, a graph database is lesser known. However, it’s incredibly useful as I would highly recommend every data engineer to have a graph database in their toolbox.
On top of other technical features, the graph database manages the content as nodes and links. The way it stores and analyses data is very similar to natural human rational. Many graph database also comes with an easy way to query and GUI presentation, making it easy to use for non-technical stakeholders. Last but not least, quite a few databases also have built-in machine learning support, making the deep-hidden secret become a no-brainer. Let’s see how it works.
The Backdrop
Recently, I worked on a data warehouse migration project to transfer an on-prem Sybase warehouse onto Bigquery. All the ETL jobs were scheduled by Informatica Workflows and Worklets, and within the data warehouse are 1100 tables, 200 views, and 700 stored procedures. I chose Neo4j for my project, as it is one of the most popular graph databases. It has sufficient capacity to cover this small dataset and its query language, called Cypher, is user-friendly.
The input data is an Excel spreadsheet with all the specifications of table, views, stored procedures, and their relationships with Informatica workflow/worklets. By using Pandas and tons of regular expressions, I extracted all the entity names and their relationship into CSV files. I then imported the cleaned data into Neo4j. The result is as shown:
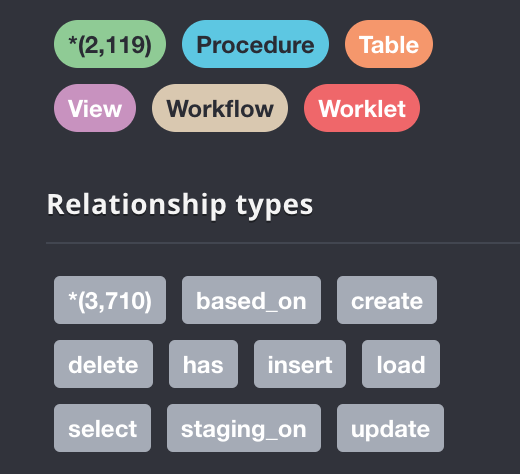
We have five data types: Procedure, Table, View, Workflow, and Worklet. There are 2119 data nodes that have been imported. There are also 3710 data relationships that have been extracted from the SQL files and imported into the Neo4j.
Now, let’s search for a single procedure:

The upper window is the Cypher query, and on the right-hand side is the list of all properties related to the stored procedure. We can see that quite a few SQL features have been recorded as properties. There are also statistics on the length of the stored procedure specification query and a flag of whether the stored procedure has been fully tested.
If we expand the connections to the store procedure, the results are as shown:
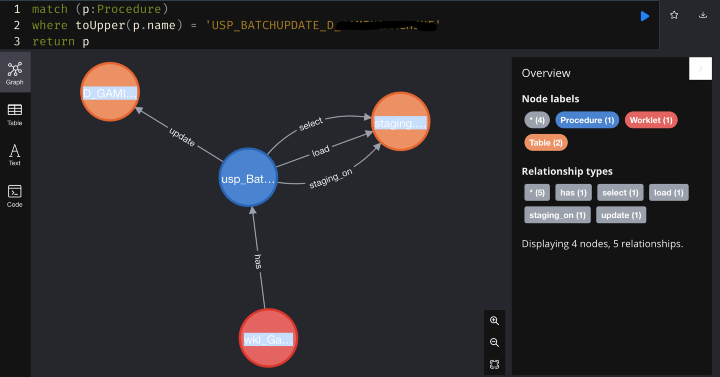
Now we found that procedure was called by one Informatica Worklet. It creates, loads, and selects one staging table and then uses the staging table to update a target table.
When we further expand the network of the target table, we will see the following:
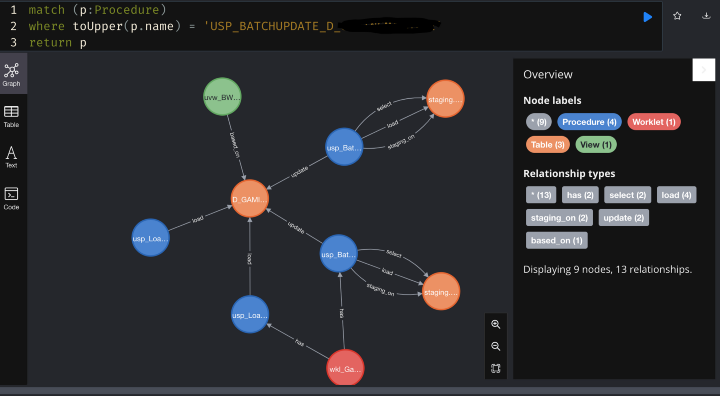
The target table also has three other procedures working on it. One of them is also being called by the same Informatica Worklet, however, the other two procedures are not controlled by any Informatica Worklet. Evidently raising the question: why are they not controlled by Informatica? Maybe they are no longer needed, maybe we need to develop a workflow for them?
I hope you can see that without having to check the SQL definition, we can clearly know how the stored procedures work, and their complexity, and even identify a problem that is not easy to spot without the aid of the tool.
Identify Patterns
To make the data warehouse migration easier, we want to identify common patterns to automate the data object conversion. We noticed that quite a few tables have either a load procedure or a batch update procedure. Let’s see how many tables contain this pattern:
There are 458 tables of such kind, having only load/ batch update stored procedures.
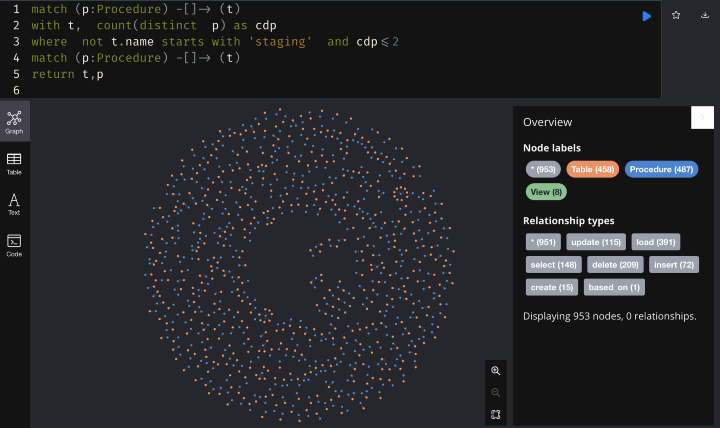
Now, let’s check the remaining tables:
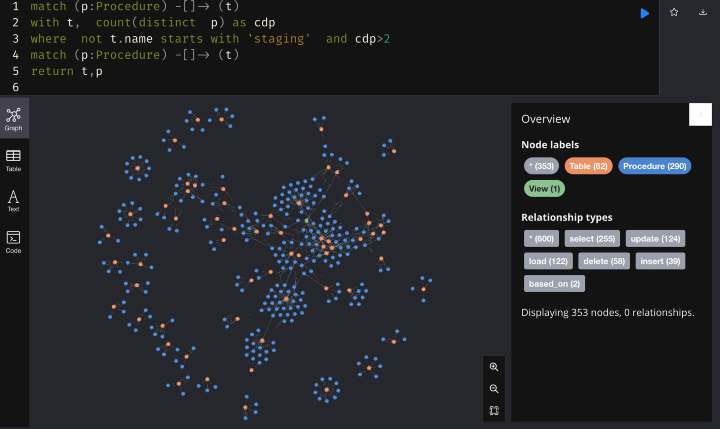
We found that the tables which have been referred by multiple procedures were scarce. Interestingly, we found that some of the procedures formed isolated cliques, whilst other procedures began forming a big community. Based on this insight, we can make sure to migrate the clique of tables and procedures into the same batch so that we can deliver the integrated function from each batch.
Machine Learning
My data warehouse migration project doesn’t need machine learning. But just for demonstration, let’s see how to run a PageRank for the nodes based on the linkages. Bear in mind that PageRank is the algorithm invented by Google for their Internet search engine.
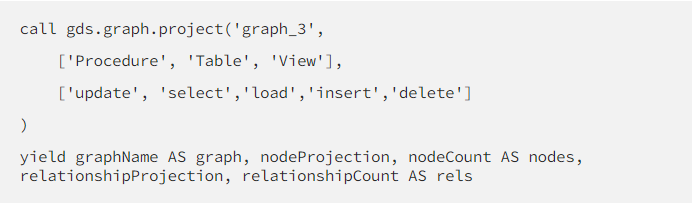
Step 1: Generate a memory projection of the graph, specifying the relationships we want to include:
Step 2: Generate a PageRank score for the node:
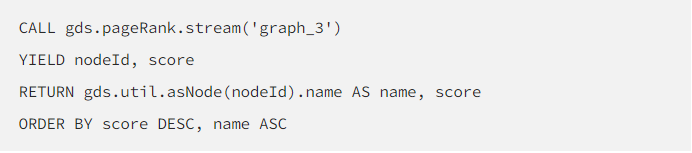
That’s all!
We can use the graph database in many creative ways. For example, analyze the similarity of procedures to identify duplicated code, link data nodes to the data catalogue, etc.
Reach out to us here at intelia if you’d like to find out more or if you’re keen to find out how we can help your business!