Enterprises Struggling with Inconsistent Data Definitions

-
- Inconsistent Data Definitions
-
- Lack of common understanding of data

-
- Universal Semantic Layer
-
- Intelligent Data Virtualisation
-
- Single view of organisation’s data
-
- Simplified user interaction with data
Challenges:
As enterprises turn towards data driven strategies; one of the challenges they face is to have a common business understanding of the data. Different departments in the same enterprises often establish different definitions for the same business processes or data artefacts. For example, what is “net sales”; a department might interpret it as net of invoice line-items and another department might interpret it as net of rebates. Without some level of abstraction or consistency, business is dependent to IT to generate and run reports or risk making big, costly and worst of all hidden mistakes.

Solution:
There are various ways to tackle these problems however the most effective one would be to have a unified location like a Semantic layer to define all business definitions. This will make sure consistent enterprise-wide reporting regardless of the Business Intelligence tools. Business users often struggle with understanding the business meaning of data and end up with different interpretation of same data. A semantic layer offers a consistent complaint view of data and enable data analysts to find out accurate meaning of the data in business context quickly and effectively.
How AtScale can help?
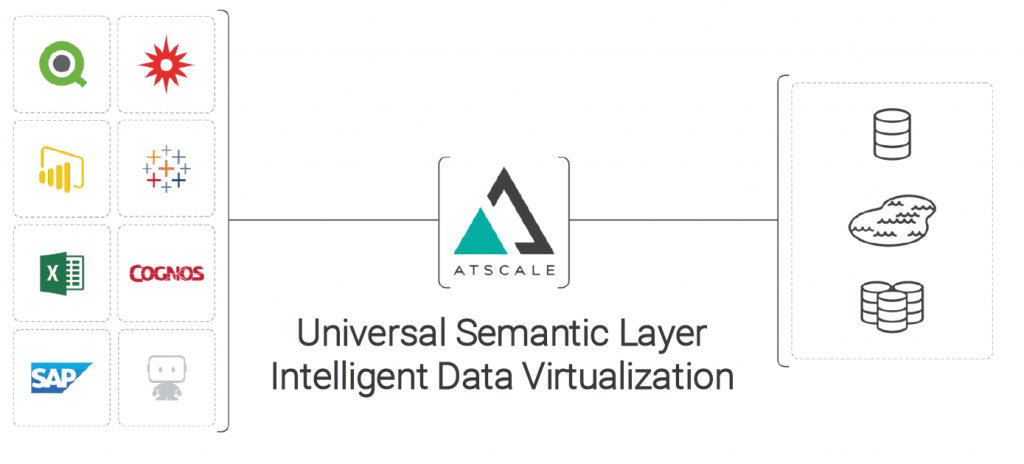
AtScale ensures all data sources are accessible from a common logical data access point. It provides a bridge across data warehouses, data marts, and data lakes, delivering a single view of an organization’s data without having to physically integrate it. AtScale’s universal semantic layer abstracts away the technical aspects of stored data, such as location, storage structure, API, access language, and storage technology. This abstraction enables enterprises to use their data, no matter where it’s stored, to produce fast, timely insights.
A semantic layer simplifies the user’s interaction with data and makes it easy for them to identify the areas they want to explore. Data Fields required by the business are exposed to the business users; these fields are identified and given meaningful names that make sense to the business users. The dimensions, the measures, and the hierarchies are defined centrally. Users can then drag and drop these dimensions and measures in their charts and reports without worrying about the complexity of the data that lies underneath. When complex data is presented in an easily understandable way, it promotes data usage and encourages more teams to use the available data.