Snowflake ABS Datasets:
We have published these marketplace listings to make it easier for businesses and organizations to access and use data from the Australian Bureau of Statistics (ABS) without doing any ETL. The ABS is a government agency that collects and publishes a wide variety of data on the Australian economy, society, and environment. This data can be used for a variety of purposes, such as market research, economic forecasting, education analysis, etc.
The marketplace listings can be accessed through the Snowflake Marketplace. To access the listings, you will need to create a Snowflake account and sign in to the Marketplace if you don't have one already. Once you are signed in, you can search for the listings by keywords or use the direct links below. Simply click get and the data is ready to access in your own snowflake instance.
**Note: These listings are currently restricted only to Australia.
Here are the specific listings that intelia has published on the Snowflake Marketplace for 2022:
Regional Statistics - ASGS & LGA
Socio-Economic Indexes for Areas (SEIFA)
Data by Region Methodology
(Please click the headings above to launch webpages)
ABS 2021 Socio-Economic Indexes for Areas (SEIFA)
SEIFA (Socio-Economic Indexes for Areas) by the Australian Bureau of Statistics ranks Australian regions based on socio-economic advantage and disadvantage, using Census data. SEIFA 2021, built on Census 2021 data, consists of four indexes focusing on socio-economic aspects. It aids in funding decisions, identifies business prospects, and supports research on socio-economic connections. It offers consistency with past releases but also introduces changes in geography and variables. Interpreting SEIFA involves understanding it assesses areas, not individuals, and it's best used for ranking and comparison rather than quantification.
(Please click the heading above to launch webpage)
ABS 2021 Census of Population and Housing: Census Dictionary
The 2021 Census dictionary serves as a detailed guide to Census variables and concepts, aiding data users in comprehending and interpreting Census data. It includes sections on changes since 2016, an alphabetical variables index, topic-based variable grouping, and a glossary. The dictionary outlines each variable's definition, scope, categories, creation process, related questions, historical changes, and usage considerations. It's designed to enhance the understanding of Census data, which is available in standard products.
(Please click the heading above to launch webpage)
ABS 2021-2022 Data by region methodology
The Data by region release provides data spanning 2011-2022, including Census data for 2011, 2016, and 2021, covering over 4,500 Australian regions. It encompasses 800+ data items across themes like Population, Economy, Income, Education, and more. Geographical coverage includes Australia, States, Territories, Capital City Areas, Statistical Areas, Indigenous Locations, Remoteness Areas, and Local Government Areas. Data is sourced from ABS and non-ABS collections, including Census and administrative datasets. Caution is advised when comparing income data from sources like the Australian Taxation Office (ATO) and Census. Updates involve geography changes, new data series, and revised data.
(Please click the heading above to launch webpage)
Example Usage:
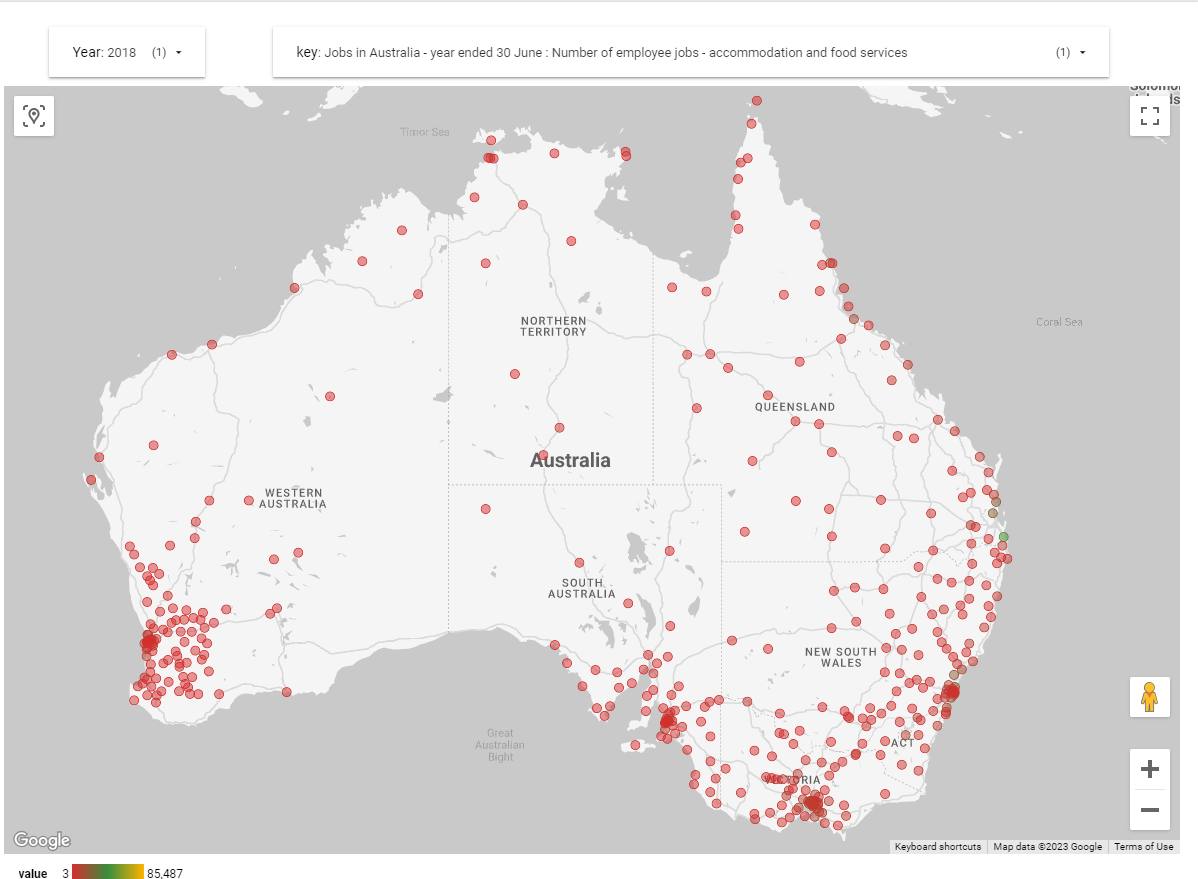
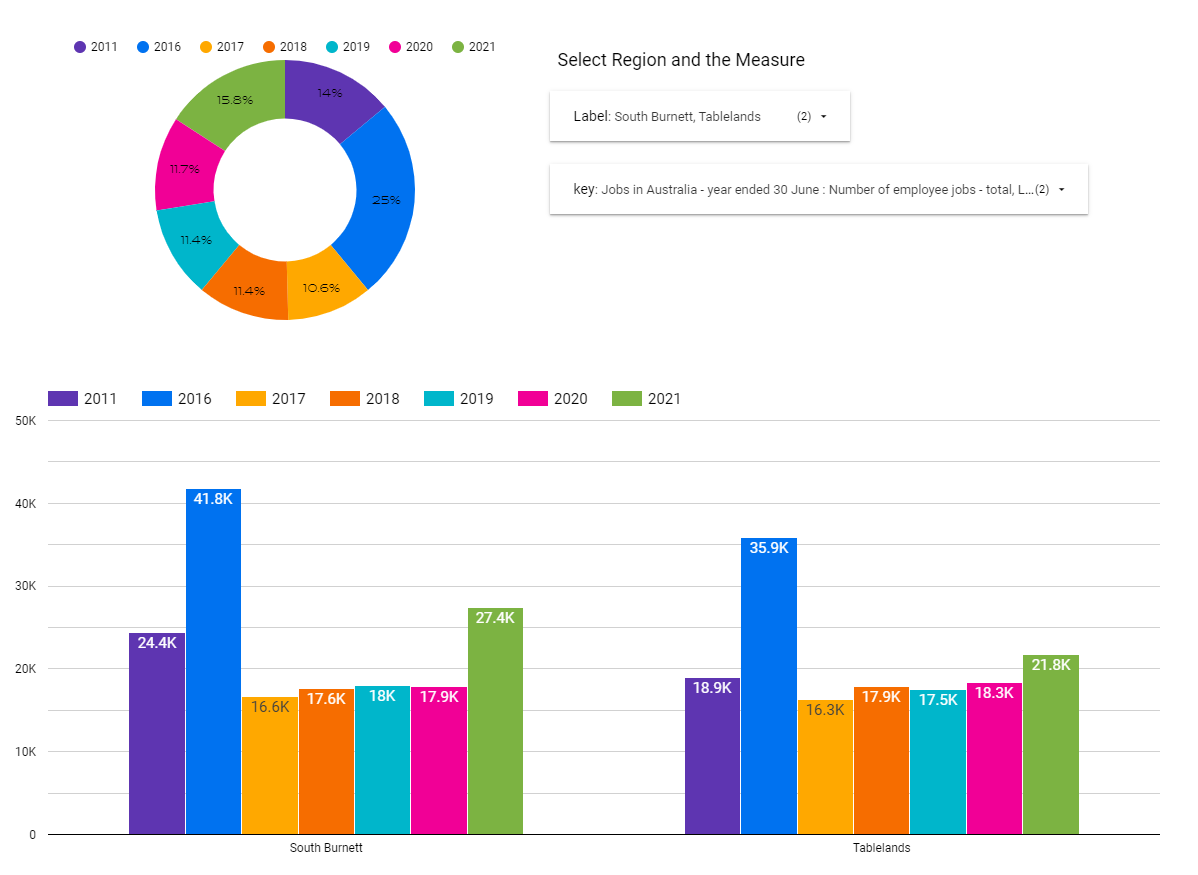
The following dashboards are examples of how the data can be used. The first map shows the number of employee jobs in Australia in 2018, and the second dashboard shows the distribution of employee jobs over time and year-by-year comparison.
Here are some specific examples of how the data can be used:
- The map could be used to identify areas with a high concentration of employee jobs, which could be of interest to businesses looking to relocate or expand.
- The dashboard could be used to track changes in the distribution of employee jobs over time, which could be used to identify trends and inform economic development strategies.
- The data could also be used to compare the distribution of employee jobs across different industries or sectors, which could be used to identify opportunities for growth or collaboration.